Dental Treatment Presented vs Accepted – Measuring and Tracking Dental Case Acceptance Rate
If you’ve ever had to deal with the business side of managing a dental practice, you’ve probably come across the phrase “dental case acceptance rate” somewhere.
Whether it’s a magazine article, a Facebook Ad, a discussion thread on a dental forum, a CE course at a dental convention – you’ve been pitched on how to “increase overnight”, or “2x” or “10x” your case acceptance rate.
My goal today isn’t to do that.
Our goal is to give you the right visual tools at your fingertips through Teamio Analytics to help you make important decisions that drive real results for your practice.
Dental case acceptance is a subjective matter because everyone has their own way of calculating it.
However, we can objectively look at important data points that can help you calculate the case acceptance rate.
What is Dental Case Acceptance Rate?
It is simply the ratio of how much treatment has been “accepted” compared to the amount of treatment that has been diagnosed or “presented” to the patient.
accepted treatment $ : diagnosed treatment $
You’re comparing the dollar amounts of treatment that is accepted vs the total dollars of treatment presented.
What is considered as accepted dental treatment?
A treatment is considered accepted when the treatment that is diagnosed is either scheduled or completed.
Diagnosed treatment is the procedures you’ve recommended for a patient that are entered into their chart on your Practice Management System (PMS).
For the rest of the discussion, we’re going to assume you’re using Open Dental as your PMS in your office as Teamio exclusively only integrates with Open Dental.
If you’re using something else besides Open Dental in your practice, the same ideas and concepts apply.
How is dental case acceptance rate percentage measured?
(Total $ amount of treatment accepted / total $ amount of treatment diagnosed) X 100
To calculate the dollar amount of treatment that is accepted, total up the amounts of treatment that is either scheuduled or completed from what was presented to the patient.
This includes treatment that is completed on the same day as it is diagnosed.
Take the number you got from the step above, and divide that by the total dollar amount of treatment presented to the patient (enterd into their treatment plan).
Take the answer from step above and multiply it by 100 to get the % value for case acceptance rate.
How does Teamio track dental case acceptance with Open Dental?
With our latest released Treatment Presented Vs Accepted analytics tool, you’ll be able to see over a period of time trends in how much treatment is diagnosed and how much is accepted.
Whenever any treatment is recommended or added to a patient’s treatment plan – that is tracked as the amount of treament diagnosed for that particular patient.
We don’t just limit it to tracking per patient – we also track it down to the individual procedure level because you can filter the data you’re looking at by either procedure type or procedure code.
Let’s show how Teamio tracks and measures case acceptance by looking at an example:
Let’s assume you want to see how many crowns have been treatment planned in the last three months and, of course, you’d like to how much of that treatment has been accepted.
How many of those crowns were either completed or scheduled in the same time period.
Let’s say for the time period you define the From and To dates as 10/1/2024 – 12/31/2024 (3 months)
Since you’re looking for a single procedure – in the Procedure code: you’d select the code you’re looking for: D2740, for instance.
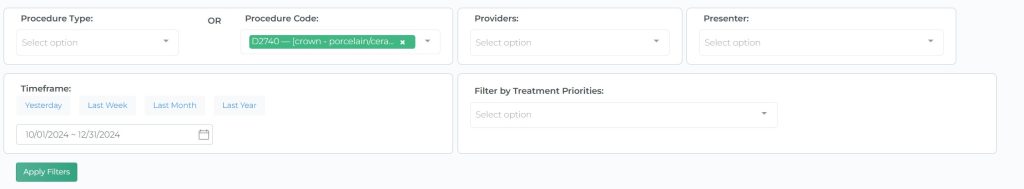
If you have multiple doctors in your practice, but let’s assume you don’t care to limit the search by a specific provider, but instead want to see the entire office treatment planned crowns – then you leave the Providers field blank.
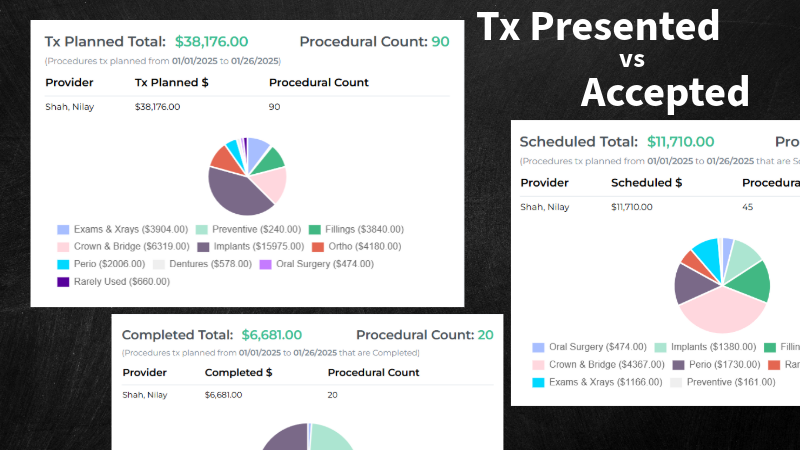
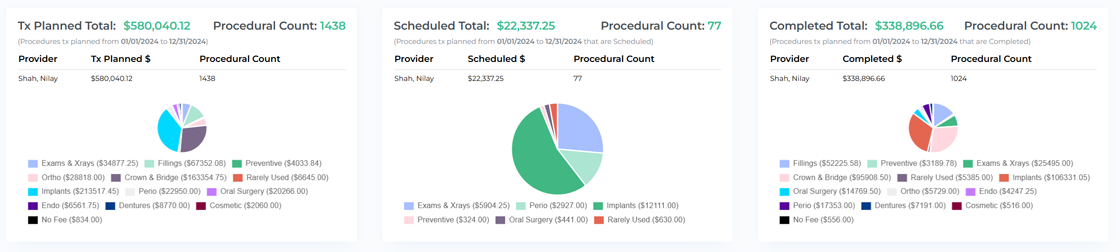
What you see is the following:
Treatment Planned Total:
Shows you the total net dollar amount value attached to the treatment planned crowns.
If the crowns are for insurance patients, it will only take into account the insurance fee for the crown.
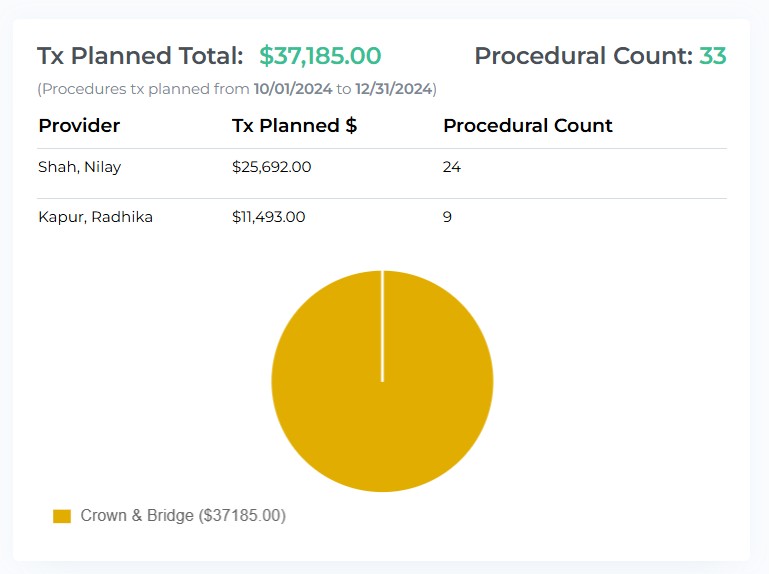
If the patient is a fee for service, or a discount membership plan patient – the discounted or the fee for service charge for the crown will be counted, as reflected in their treatment plan in Open Dental.
Procedural Count: The total # of crowns treatment planned in the time period.
If you’ve got multiple providers in the practice including hygienists, the breakdown will show crowns treatment planned by the hygienists in their operatory, and crowns treatment planned by the doctors, etc.
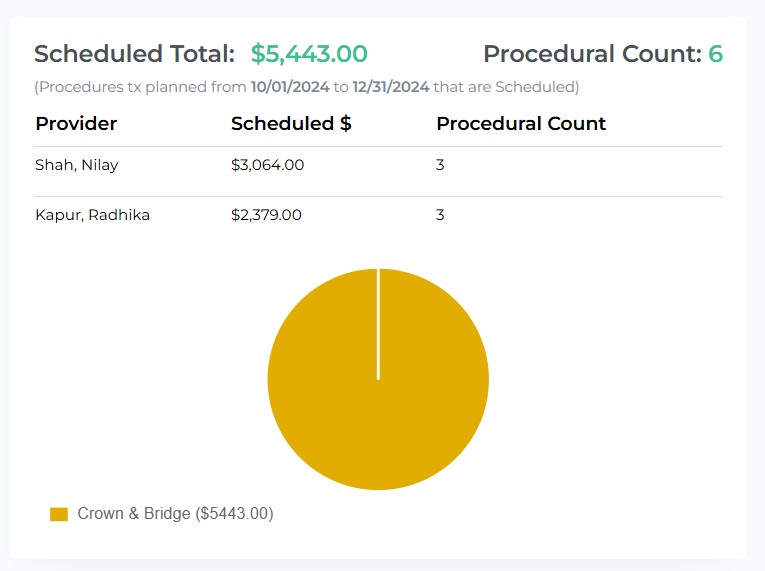
Scheduled Total:
At the time of running this report, if the crowns treatment planned from 10/1/2024 to 12/31/2024 have a scheduled status (not completed yet), then Teamio will include that total here.
Again, it will show you the breakdown by providers.
Completed Total:
At the time of running this report, if the crowns treatment planned from 10/1/2024 to 12/31/2024 have been completed, then Teamio will take the net dollar amount of production completed for those crowns.
You will also see a breakdown by providers and see which providers have contributed how much production to the total.
Dissecting the Pie Charts:
The pie charts for each of the three panels shows the breakdown of by procedure category as defined in your Open Dental set up.
The dollar amount listed next to each procedure category is the portion from the total listed.
In the example above, you’re looking at Total Treatment planned, Scheduled, and Completed procedures (hypothetical data) from 1/1/2024 to 12/31/2024.
This is a resulting data after you’ve left the Procedure Code and Procedure Type filter drop-downs blank, because you want to see all treatment planned procedures regardless of the procedure code or the procedure category.
- Tx Planned Total: Net dollar amount treatment planned from time period 1/1/2024 – 12/31/2024
- Procedural count: Total count of procedures treatment planned in the time frame listed.
- Provider Tx Planned $: Net dollar amount treatment planned by this provider in the listed time frame.
- Provider Procedural Count: Total count of procedures treatment planned by the provider in the listed time frame.
- Pie Chart Legend: Shows you breakdown of net dollar amount treatment planned by procedural category.
- Scheduled Total : As of the present day, which of the procedures treatment planned in 2024 still have a “scheduled” status in Open Dental. These procedures are scheduled in the future as of the date of pulling up this report.
- Completed Total: As of the present day, which of the procedures treatment planned in 2024 have a “completed” status in Open Dental – these are procedures that are completed as of today.
Dissecting the Yearly Data Tables
Looking at the same example data for treatment planned procedures in all of 2024 (from 1/1/2024 to 12/31/2024)
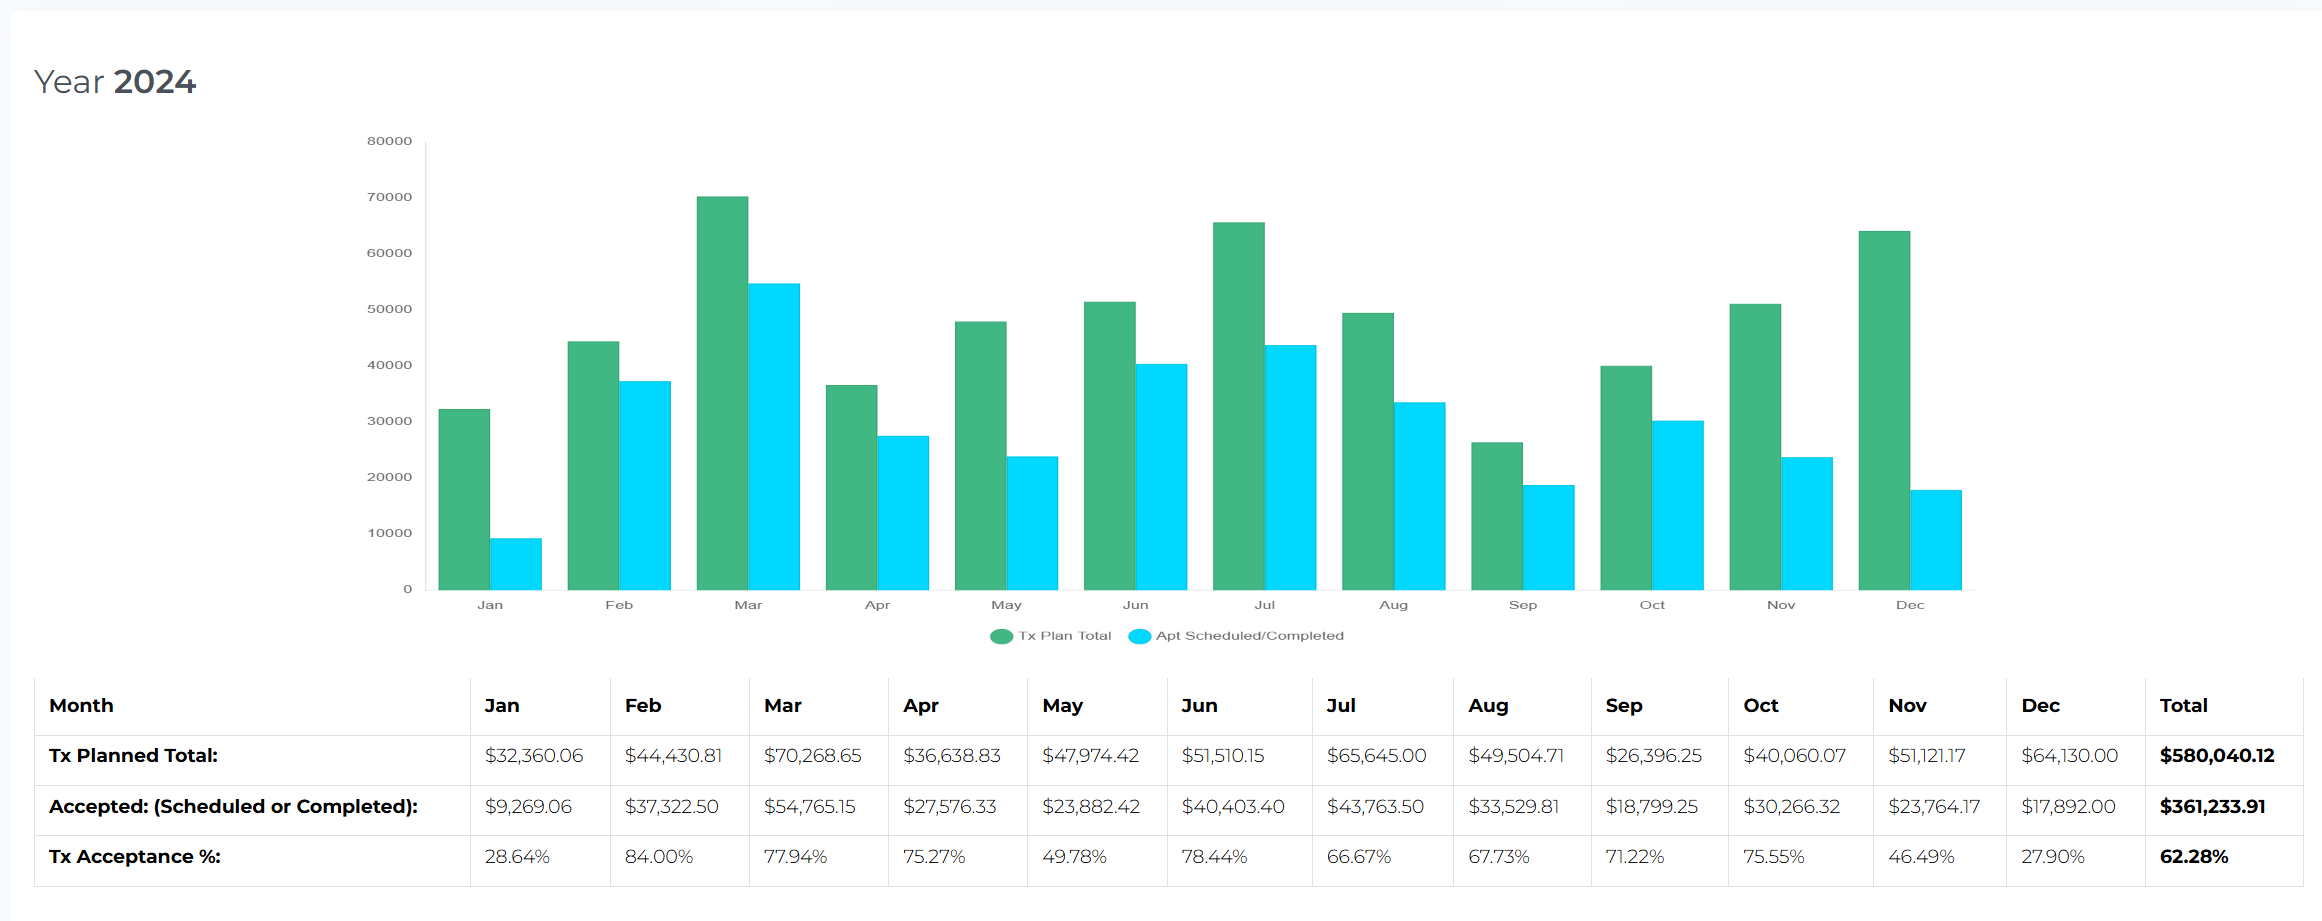
The yearly data will show me data for each year that’s included in the time frame.
In this case, you’ll see a table and bar graph data for the year 2024.
What data am I looking at?
For each year, and each month will show net dollar amount of diagnosed treatment.
So for 2024, in the month of January, $32,360.06 is diagnosed.
As of today, of the diagnosed treatment, anything treatment planned in the month of January of 2024, $9,269.06 is accepted (completed + scheduled). Accepted includes scheduled because you could’ve treatment planned something in 2024 January, and maybe the patient finally scheduled the procedure in January of 2025.
Let’s say a crown was treatment planned in January of 2024 and it’s finally done in the month of June 2024 – the production dollar amount completed for that crown goes towards the Accepted treatment for the month of January 2024.
This is an important thing to understand.
Filtering Open Dental data to get more insights:
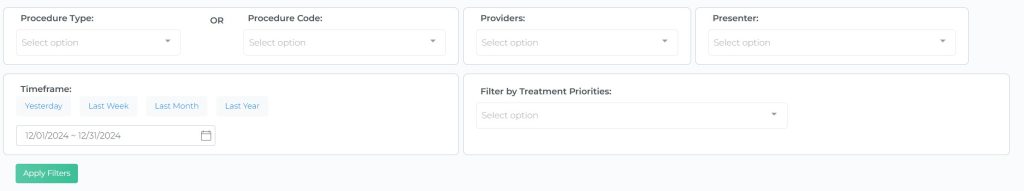
Procedure Type:
The drop-down displays all procedure categories you have set up in Open Dental.
This is useful when you’d like to find out, for instance, the following things:
- All fillings treatment planned in a custom time frame
- Surgical procedures treatment planned in a custom time frame
- Data on how may Crown & Bridge procedures you’ve treatment planned in a time frame and how many of those got scheduled and / or completed.
Procedure Code:
The drop-down displays all procedures that exist in your Open Dental, which you can search with auto-suggest.
This is useful when you’d like to find out data based on a single procedure code:
- How many all ceramic crowns (D2740) did we treatment plan in the last six months
- How many implant placements (D6110) have we treatment planned so far this year, and how many got scheduled or completed.
- How many bone grafts (D7953) have we diagnosed this year, and how many got scheduled or completed.
Providers:
The drop-down displays all active providers in Open Dental.
This is useful when you’re trying to look up data regarding what’s treatment planned by a provider and what’s getting accepted.
- How many crowns treatment planned by Dr. A compared to Dr. B in the last 6 months. Who had a higher acceptance rate?
- How many implants were placed by Dr. A in the last six months
- Of all the mouthguards treatment planned in 2024, how many got scheduled and / or completed?
Treatment Priorities:
The drop-down displays all treatment priorities created on your Open Dental – (the ones you see in the Tx Plan module when looking at a patient’s treatment plan.
This is a useful filter if you want to leave out treatment that has been marked as “rejected” or “wait”, or “phase II” or “second alternative”, “third alternative” etc.
If you’re pulling up data to see treatment planned procedures and see what’s accepted – by filtering out treatment that is “second alternative”, for instance, you’re not looking at skewed data because you don’t want to count those dollar amounts in your treatment planned vs accepted data.
Presenter:
In order to filter by presenter, or treatment coordinator who maybe presenting treatment plans to patients – they must be assigned to a saved treatment plan in Open Dental as recommended by Open Dental.
Saving Treatment Plans:
Let’s assume you’ve got a large treatment plan for a patient.
For Phase I, you may select all the procedures you want to have fall into Phase I.
Once you save the treatment plan, you can call it Phase I.
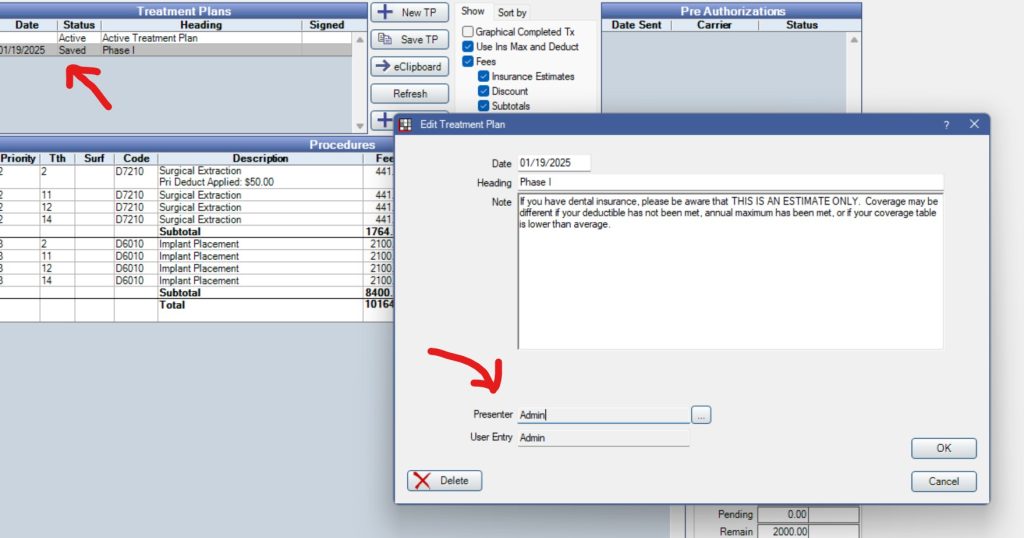
While you’re saving the treatment plan, you select who the presenter is, and that’s where you’d select who’s presenting the treatment plan.
If you’ve been consistently assigning Presenters in Open Dental to your saved treatment plans, you can pull up data to help you with the following:
- How much was presented by Employee 1 and how much got accepted?
- Of all treatment planned implants in 2024, what was the acceptance rate (scheduled and / or completed) when presented by employee 1 compared to employee 2 for the same time period.
How should I use this feature of Teamio Analytics in my own practice to drive decisions that create results?
To understand how you can use this, let’s start with some examples of questions you’ll be able to answer using this tool.
Treatment planned vs accepted for the whole office:
How many crowns were treatment planned in the last month, and how many actually got scheduled? How many of those were completed?
How much was treatment planned in the last 6 months in my practice?
Of all that was planned in the 6 months, how much $net production was scheduled? How much $net production was actually completed?
Breaking down Treatment planned vs Acceptance by Doctors:
How many mouthguards were treatment planned / diagnosed by Doctor X, and how many of those got scheduled and/or completed? What was the net production resulting from those diagnosed crowns?
How many implants were placed in the last six month by Doctor X?
How many invisalign treatments were treatment planned this whole year?
Tracking diagnosed treatment for different Hygienists employed in the office:
Of the three hygienists I have for the last year, who’s planning for clear aligner consults from their room?
Which is hygienist is prescribing more take home whitening treatments?
Tracking diagnosed vs accepted treatment by Procedure Category:
How did we do in 2024 compared to 2023 when it came to diagnosing full mouth scaling and how much was actually completed?
How many crown & bridge units were completed in the last 3 months?
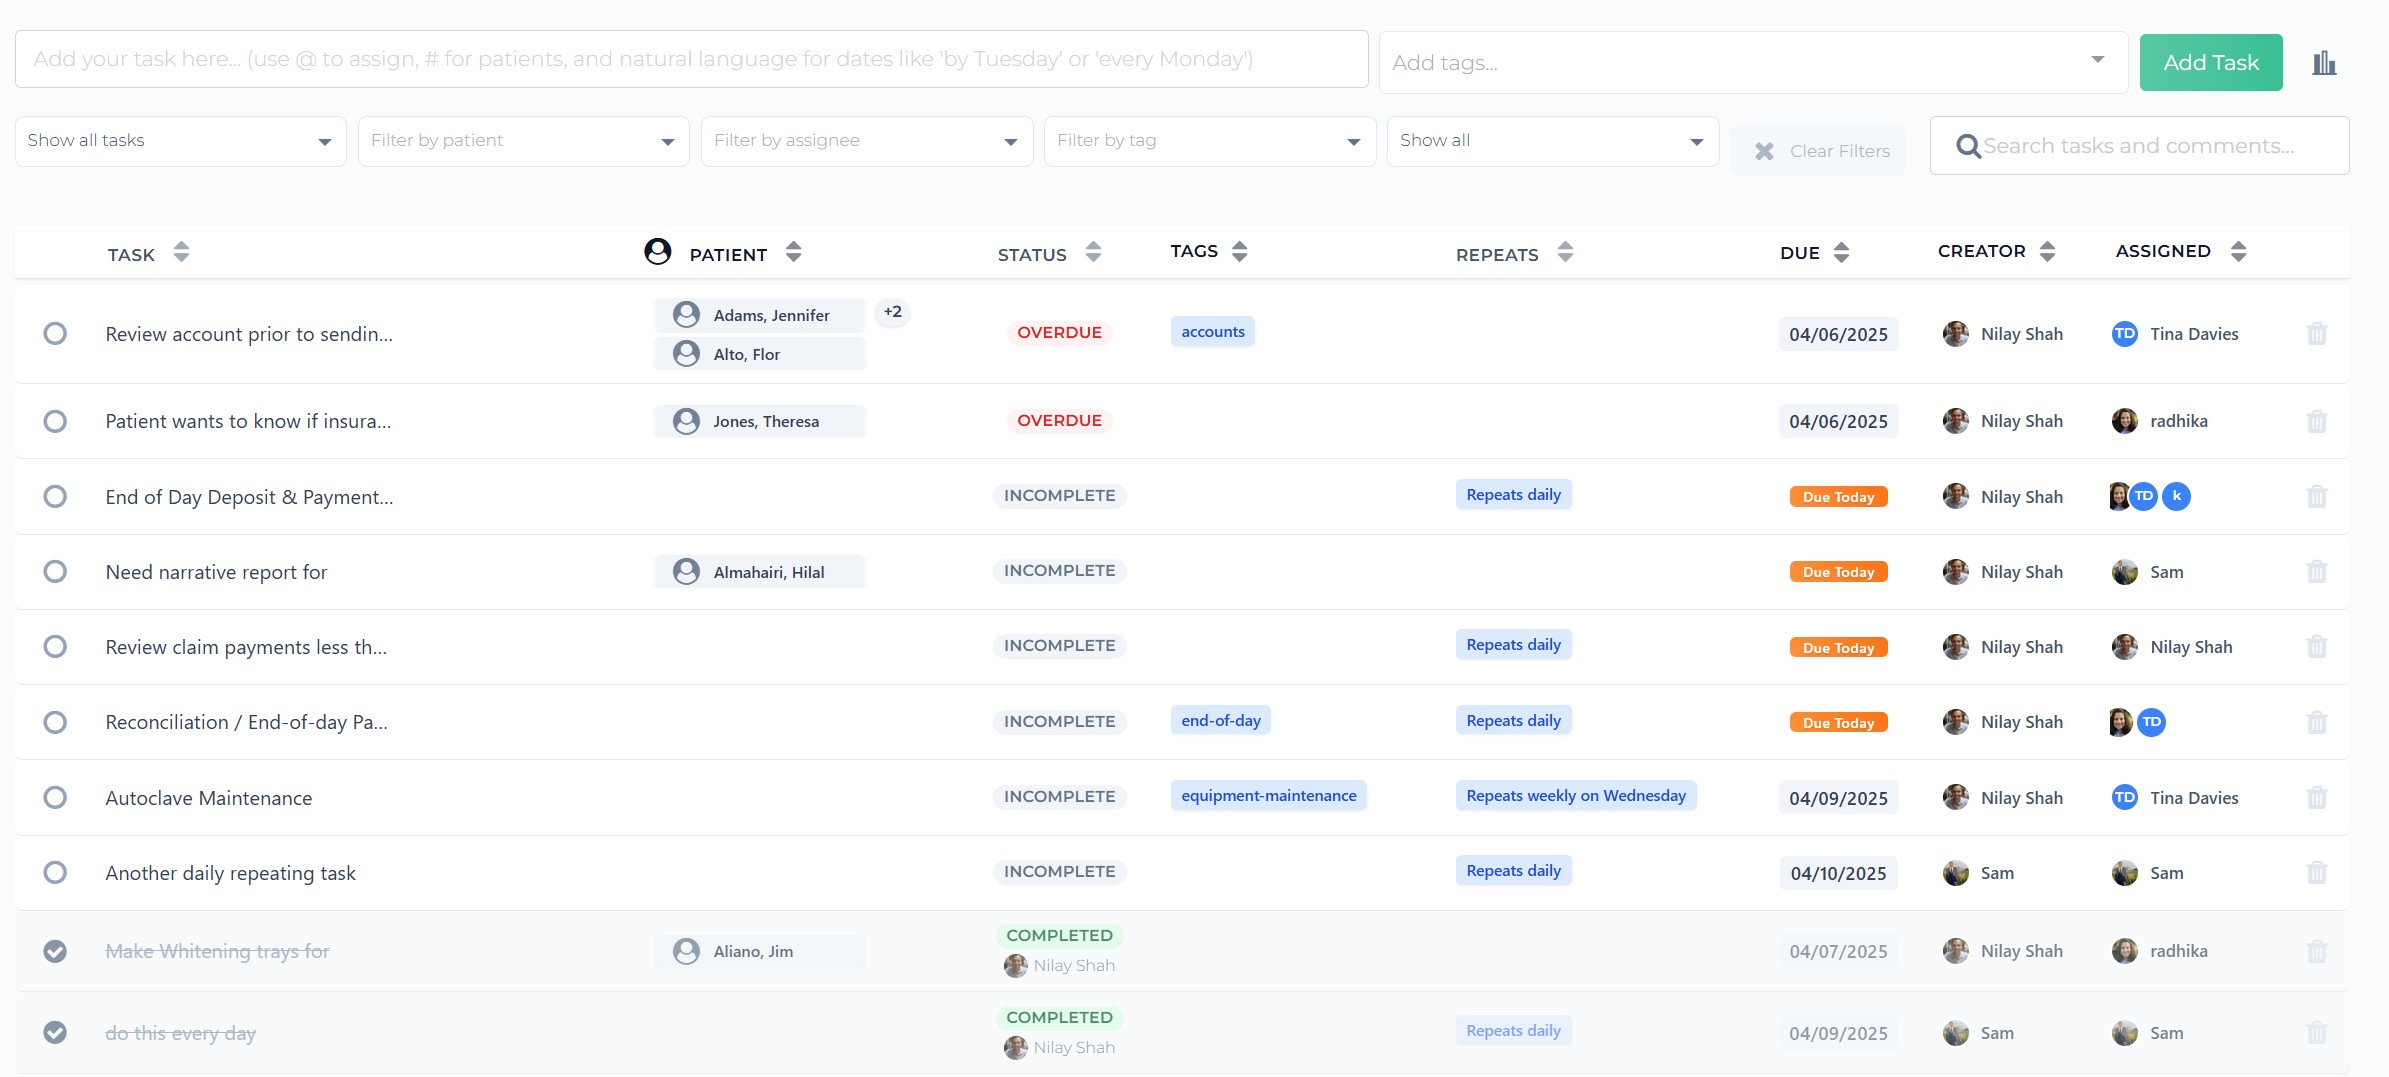
Other Feature Updates
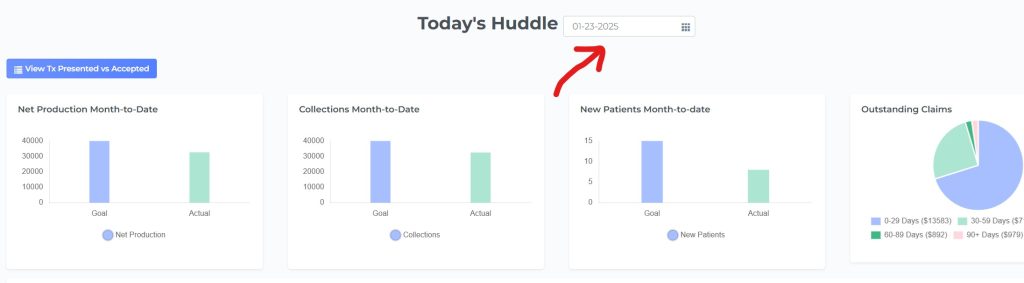
Other Huddle Update
We’ve introduced a way to pull up KPI data for custom date
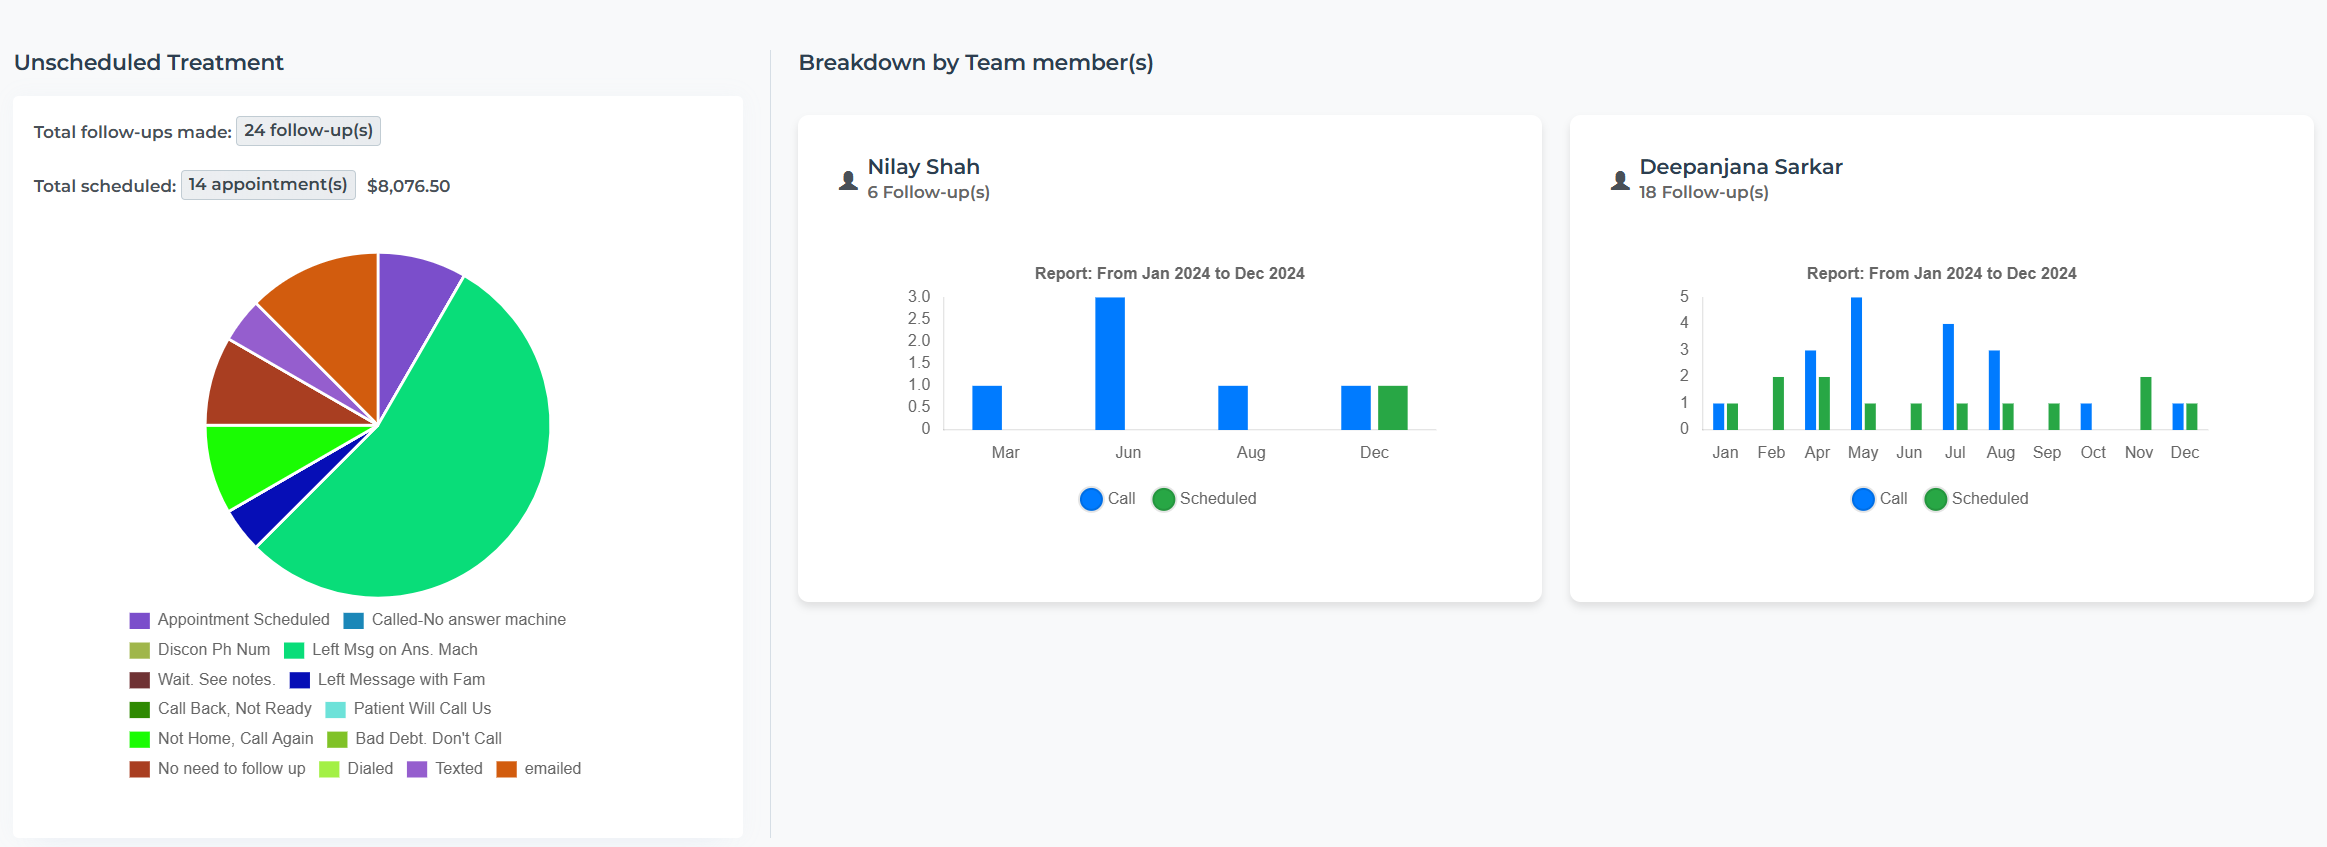
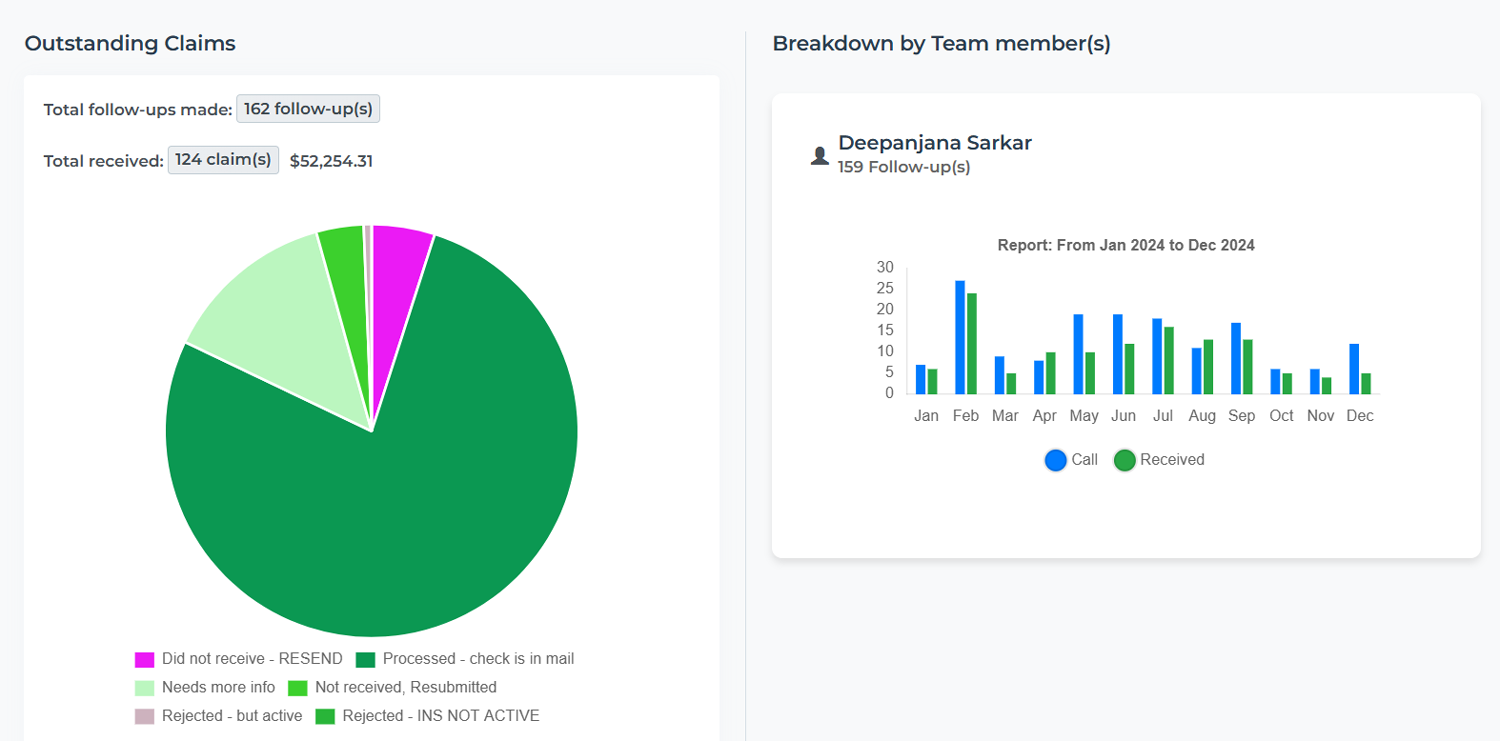
Team Insights
Team Insights graphs and charts have been updated taking into account some bug fixes.
We’ve utilized a newly updated charting system to display data that is more clear and easy to understand.